

DDP Atlas Research | October 2026 | UNCTAD Port Liner Shipping Connectivity Index (PLSCI)
Research in brief. This China Port Connectivity Report 2026 explains how leading Asian container gateways compare in the Port Liner Shipping Connectivity Index and what those differences can—and cannot—tell importers planning ocean shipments from China. The analysis uses selected publicly reported UNCTAD observations. It is not a freight-rate index, container-throughput ranking, booking forecast or carrier reliability report.
For procurement teams, a port's position in an international liner network is useful context. But a shipping decision also depends on where goods are made, the available carrier services and cut-offs, the final delivery address, customs responsibilities and the commercial terms of the quotation. A strong connectivity score cannot replace those shipment-level facts.
At a glance
- Indicator: Port Liner Shipping Connectivity Index (PLSCI), UNCTAD indicator
US.PLSCI. - Geography: Selected individual ports, not countries or China-to-destination trade lanes.
- Primary reporting period: Q3 2026, rounded index points as reported in the source research table.
- Additional reference: Singapore, Rotterdam and Jebel Ali at Q1 2026. Those values must not be plotted or ranked as if they were Q3 figures.
- Editorial use: Please cite UNCTAD as the original source and DDP Atlas Research for the selection, commentary and visualization; no UNCTAD endorsement is implied.
Key findings from the selected Q3 2026 port sample
| Port | Q3 2026 PLSCI (rounded index points) | Reading the figure correctly |
|---|---|---|
| Shanghai | 2,439 | High network connectivity in the selected sample |
| Ningbo-Zhoushan | 2,110 | A major Chinese gateway with substantial network reach |
| Singapore | 1,883 | High connectivity, reflecting an important international network role |
| Busan (Pusan) | 1,655 | High connectivity within the selected Asian gateway set |
| Qingdao | 1,422 | Significant network connection in the selected sample |

Figure 1. Selected Q3 2026 port PLSCI index values, rounded to whole points. Source: UNCTAD; visualization: DDP Atlas Research.
How to read the table: These are selected ports, not a complete global top-five ranking. The values are PLSCI index points, not annual TEU, dollars per container, transit days or probabilities. Rounded figures are suitable for editorial overview; consult the underlying UNCTAD series for precise analysis and any later revisions.
The sample places two Chinese gateway systems—Shanghai and Ningbo-Zhoushan—above the other illustrated ports on this specific connectivity measure. That is useful to understand global shipping-network structure. It does not establish that either port is always the best choice for a particular factory or consignee.
What exactly does PLSCI measure?
UNCTAD's Port Liner Shipping Connectivity Index is a statistical indicator of how a port is connected to the worldwide container liner-shipping network. Connectivity is a structural attribute of the network. It provides a different perspective from physical cargo throughput, daily port congestion, vessel delay, warehouse congestion or individual carrier sailing schedules.
For importers, this distinction matters. A higher connectivity value may indicate broader integration into the global shipping system, but it does not tell you whether a specific weekly service has equipment available, whether cargo will meet the next cut-off or whether an inland warehouse can accept delivery. Those questions require an actual operational quotation and routing plan.
The same caution applies to terms such as direct service, transshipment, and on-time delivery. These are not interchangeable. A network-level index can provide context for analysis, but service-level routing must be independently checked with the forwarder and carrier.
Shanghai versus Ningbo-Zhoushan: the decision importers actually face
A business sourcing from multiple Chinese suppliers may reasonably compare Shanghai and Ningbo-Zhoushan. The PLSCI chart gives one input into that conversation—not the answer by itself.
Suppose a buyer collects goods from factories in Suzhou, Yiwu and Shaoxing. This is a hypothetical planning example, not a documented DDP Atlas shipment. A forwarder should determine the inland pickup and consolidation plan before selecting the port. If cargo must travel a long distance to a higher-scoring gateway, trucking and handling could outweigh any perceived network advantage. Conversely, a particular sailing, delivery commitment or equipment constraint might favor that gateway for the specific shipment.
A practical comparison should ask:
- Factory-to-gateway move: Where will cargo be packed, checked and consolidated? What are the pickup addresses and warehouse opening times?
- Carrier service: Which carrier and service are proposed? Does the plan use a direct sailing or a connection through another hub?
- Cargo timing: What is the confirmed cargo-ready date, receiving cut-off and latest acceptable delivery date?
- Container and cargo fit: Is this LCL or FCL? Are there hazardous, oversized, temperature-sensitive or other special-cargo requirements?
- Destination scope: Is the quotation port-to-port, port-to-door or genuinely door-to-door? Who handles customs and the final appointment?
- Exceptions: What happens if the sailing changes, equipment becomes unavailable or cargo misses the cut-off?
Practical takeaway: compare the entire shipment plan, not one number on a port ranking.
A separate reference: Singapore, Rotterdam and Jebel Ali in Q1 2026
| Port | Q1 2026 PLSCI (index points) |
|---|---|
| Singapore | 1,874.417 |
| Rotterdam | 951.945 |
| Jebel Ali | 775.482 |
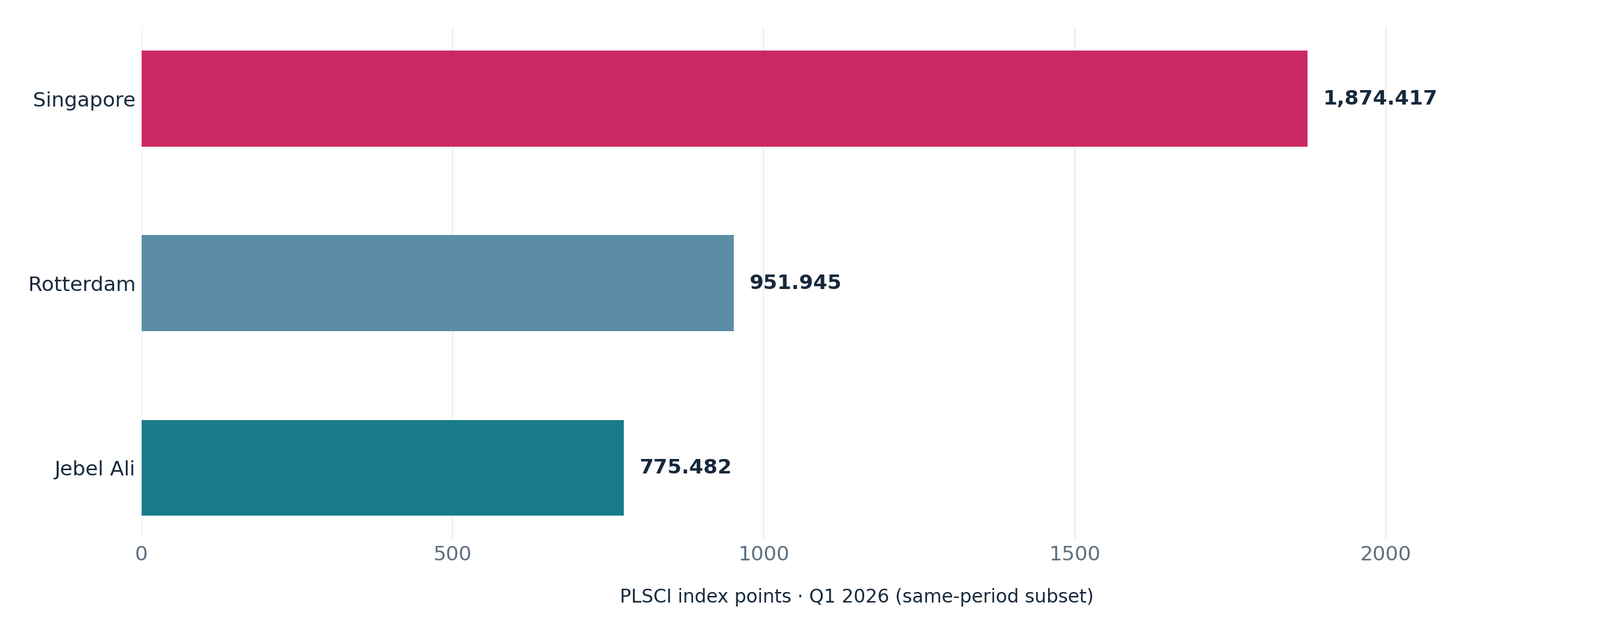
Figure 2. Selected global port PLSCI values, all Q1 2026. Source: UNCTAD; visualization: DDP Atlas Research.
These three values share the same Q1 2026 reporting period in DDP Atlas's approved PLSCI dataset. They provide a reference for how individual gateways appear in the network, but they should not be combined with the Q3 table as if every figure were simultaneous. No comparison here means that a shipment from Shanghai to Rotterdam is cheaper, quicker or more reliable than a shipment to Jebel Ali.
This report deliberately keeps the time periods separate. Where a source provides only an earlier observation for a gateway, the editorial presentation should show that date instead of filling the gap with an estimate.
Five mistakes to avoid when using port-connectivity charts
Mistake 1: Reading index points as container volume. Annual or monthly throughput measures a different phenomenon. The World Bank's country-level container port traffic series is not a replacement for an individual port's PLSCI.
Mistake 2: Treating a strong index as a rate guarantee. A connectivity indicator has no USD/container quote attached to it. Carrier rates, local charges, free time and inland delivery must be quoted separately.
Mistake 3: Assuming the highest-scoring port is always the cheapest origin. China's manufacturing geography and export consolidation decisions may change the commercial outcome.
Mistake 4: Mixing reporting periods. Comparing a Q1 record with a Q3 record without date labels can create a misleading narrative.
Mistake 5: Claiming the index predicts disruption. Congestion, port closures, carrier blank sailings and schedule reliability require dedicated operational information; PLSCI should not be presented as a real-time disruption-warning tool.
A practical decision table for China-origin ocean freight
| Question | Data that helps | What the importer should request |
|---|---|---|
| Which gateway should receive cargo? | Factory addresses, trucking requirements, service options, PLSCI context | Door-to-door routing comparisons |
| Is a transshipment required? | Proposed service rotation and ports of call | Carrier routing and handling plan |
| What is the complete cost? | Written rate breakdown with scope | Origin, ocean, destination, customs and delivery inclusions |
| Can the delivery deadline be met? | Cargo-ready date and proposed schedules | Realistic transit window plus buffer, not an index prediction |
| What happens after a delay? | Exception handling and responsible parties | Alternative routing and escalation process |
For related operational planning, see Shipping from China, the China shipping ports guide, and freight estimate tools.
How DDP Atlas selected and interpreted the data
This article is a secondary analysis, not an original UNCTAD statistical release. It draws on UNCTAD's US.PLSCI metric, using the selected Q3 2026 rounded port values and separately labeled Q1 2026 approved records available in the research package. DDP Atlas's presentation adds explanations and importer decision guidance. Missing values are not interpolated. No real-time carrier or congestion data were used to construct the rankings.
Before publication, the editor should cross-check the rounded Q3 figures with the original UNCTAD current release, confirm that source revisions have not changed the observations and keep the retrieved date visible. The pre-existing package also contains a Q2–Q3 visual sourced from an archive; do not publish that Q2 comparison until each Q2 observation is independently revalidated against an authoritative release.
- DDP Atlas approved PLSCI dataset and citation tools
- UNCTAD PLSCI data explorer
- UNCTAD shipping connectivity insight
- DDP Atlas Freight Intelligence
Suggested citation: UN Trade and Development (UNCTAD), Port Liner Shipping Connectivity Index (US.PLSCI), selected Q3 and Q1 2026 observations; visualization and importer interpretation: DDP Atlas Research, October 2026. Subject to CC BY 3.0 IGO attribution requirements. UNCTAD does not endorse DDP Atlas.
Frequently asked questions
Is the Port Liner Shipping Connectivity Index a measure of shipping prices?
No. PLSCI is a connectivity indicator, not an ocean-freight rate feed. Obtain a live quotation for the exact service and shipping scope.
Does a higher port score guarantee direct sailings to the United States or Europe?
No. The index is not a published schedule for an individual route. Verify the exact carrier service, transit legs and connections.
Can this report predict Q4 shipping delays?
No. It describes observed network connectivity; delay forecasting requires different data and validated forecasting methods.
Are these figures port-level or country-level?
These figures are port-level PLSCI observations. They must not be confused with country-level LSCI or LSBCI.
May journalists cite or reproduce the charts?
The underlying UNCTAD statistics are subject to their stated license. Editorial users should retain the original-source attribution, credit any DDP Atlas chart design or added analysis appropriately, link the research page and avoid implying endorsement. Check any third-party assets independently before reuse.
Download the research briefing
Download the companion PDF: China Port Connectivity Report 2026 (PDF) (Upload this PDF to the indicated path before publication.) Journalists can also use the source chart's Share & cite tools.
Planning a shipment rather than writing a market report? Use the Shipping Cost Calculator or request a freight estimate for the actual cargo, origin and final address. A statistical index is not a quotation.
Related planning resources: Put the port data to work with the container loading planner, review sea freight from China and China consolidation, or request a planning freight estimate.
Part of the Shipping from China hub — see the wider freight planning map.