

DDP Atlas Research | October 2026 | Data period: Q1 2026
Executive summary. The China Trade Lane Connectivity Report 2026 examines UNCTAD's Liner Shipping Bilateral Connectivity Index (LSBCI) for China and selected trading partners. The index is reported at the country-pair level, on a normalized scale from 0 to 1. It describes relative maritime network connectivity—not the actual price, shipping time, freight volume or reliability of a particular container booking.
This distinction is important for importers. A network indicator can help frame questions about access and connectivity, but it cannot tell a purchasing manager which vessel to book, which port pair has an available direct sailing or how many days cargo will spend in customs.
Data coverage: DDP Atlas's approved public series currently contains one reporting period, Q1 2026, with selected China-partner observations. This report makes no claim to describe Q2 or Q3 bilateral values. The numbers below are deliberately shown at the source's normalized scale; a score of 0.712 is not a 71.2% on-time shipping probability.
Q1 2026: China and selected trading partners
| China ↔ partner | LSBCI (Q1 2026) | Interpretation boundary |
|---|---|---|
| Republic of Korea | 0.859 | Bilateral network connectivity, not shipment performance |
| Singapore | 0.786 | Bilateral network connectivity, not a freight price |
| Viet Nam | 0.724 | Country-pair indicator, not a specific route schedule |
| Spain | 0.719 | Not a guarantee of a direct service |
| United Kingdom | 0.712 | Not a UK delivery-time forecast |
| Netherlands | 0.708 | Not a Rotterdam-specific score |
| United Arab Emirates | 0.689 | Not a Jebel Ali port-to-port score |
| United States | 0.685 | Not a quote to Los Angeles or New York |
| Saudi Arabia | 0.662 | Does not imply customs status or last-mile capacity |
| Mexico | 0.573 | Not shipment volume or an import-demand forecast |

Figure 1. China and ten selected trading partners, Q1 2026 LSBCI. Source: UNCTAD; visualization: DDP Atlas Research.
These ten partner values represent a selected sample, not a global top-ten ranking. DDP Atlas's published series includes 19 China-partner observations in this reporting period. Country names and values should be reconciled with the downloadable CSV when preparing any externally circulated chart.
What the bilateral shipping connectivity index can tell you
The LSBCI is useful as an objective starting point for discussing the structure of maritime connections between trading partners. It provides a consistent statistical vocabulary when comparing countries, particularly for professionals who need to understand international trade-network context beyond a single rate request.
It is less useful as a stand-alone purchasing instruction. Importers do not ship goods between abstract country centroids: they ship from a factory or warehouse to a receiving location, often through a combination of trucking, terminal handling, ocean transport, customs and last-mile delivery.
A competent route comparison therefore adds operational details to the index:
- Supplier location, cargo-ready date and proposed China origin gateway.
- Destination seaport and final delivery address, including warehouse requirements.
- Carrier service, actual routing and any transshipment.
- LCL or FCL requirements, special-cargo limits and capacity availability.
- Quotation inclusions, exclusions, rate validity and currency.
- Customs declaration, importer-of-record arrangements and tax responsibility.
- Delivery contingency and the escalation procedure if the planned service changes.
China to the United States: how to use—not misuse—the data
The selected Q1 2026 China–United States LSBCI is 0.685. That does not imply a shipment from Shenzhen to Los Angeles will be slower or cheaper than a shipment to New York, nor does it identify the better US gateway. Both are different operational questions.
A US importer should first define the actual consignee location, factory origin, cargo dimensions, product restrictions and importer-of-record structure. Then compare written quotations for the same pickup and delivery scope. An index may belong in a strategic market briefing; it does not replace quotes, customs preparation or carrier schedules.
See Shipping from China to USA for the destination-specific commercial questions.
China to the United Kingdom: interpreting a score of 0.712
The selected Q1 2026 China–United Kingdom value is 0.712. It should be interpreted as a normalized country-pair connectivity index, not as the chance that cargo arrives on time. Nor does it resolve whether a particular consignment needs customs entry, a suitable EORI, a broker arrangement or additional last-mile delivery services.
Consider a hypothetical example: two buyers import similar cartons from the same Chinese factory, one delivering to a London warehouse and another to a Midlands distribution centre. Even if the national LSBCI observation is identical, door delivery costs and operational requirements can differ substantially.
See the China to UK shipping guide.
China to the UAE and Saudi Arabia: what country-pair data misses
Selected Q1 2026 index values are 0.689 for China–United Arab Emirates and 0.662 for China–Saudi Arabia. The index does not specify which individual Gulf port should be used, nor does it establish the right customs, VAT or duty treatment for a particular commodity.
For a real shipment, compare the destination city, possible port entry, inland transport, importer registration, commodity restrictions and final delivery scope. The difference between a port handover and delivered freight is material, even if the international sea leg is the same.
For follow-up, see China to UAE and China to Saudi Arabia.
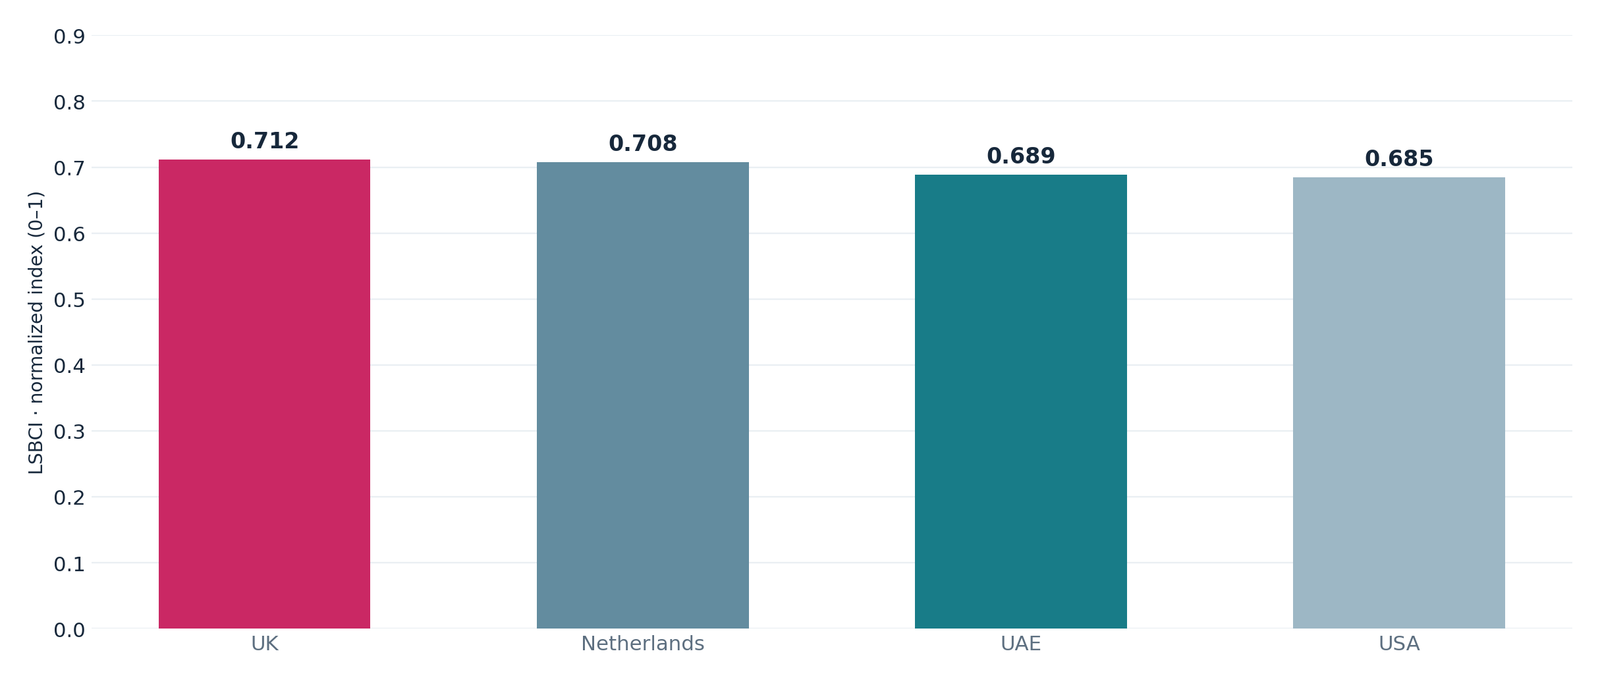
Figure 2. Selected China-to-market LSBCI comparisons, Q1 2026; these are country pairs, not port pairs.
Country pairs are not port pairs
This is one of the most important technical distinctions in freight market reporting.
- LSBCI: connectivity between two countries.
- PLSCI: connectivity of an individual port within the liner network.
- LSCI: connectivity of an individual country to the liner network.
- Container throughput (TEU): cargo volume recorded under the definition of the reporting organization.
You cannot transform a China–Netherlands LSBCI score into a Shanghai–Rotterdam port-to-port reliability score. Similarly, a higher bilateral score should not be described as lower freight rates or higher measured demand. Each statistic answers a different question.
For port-level context, see our China Port Connectivity Report 2026 and the PLSCI source dataset.
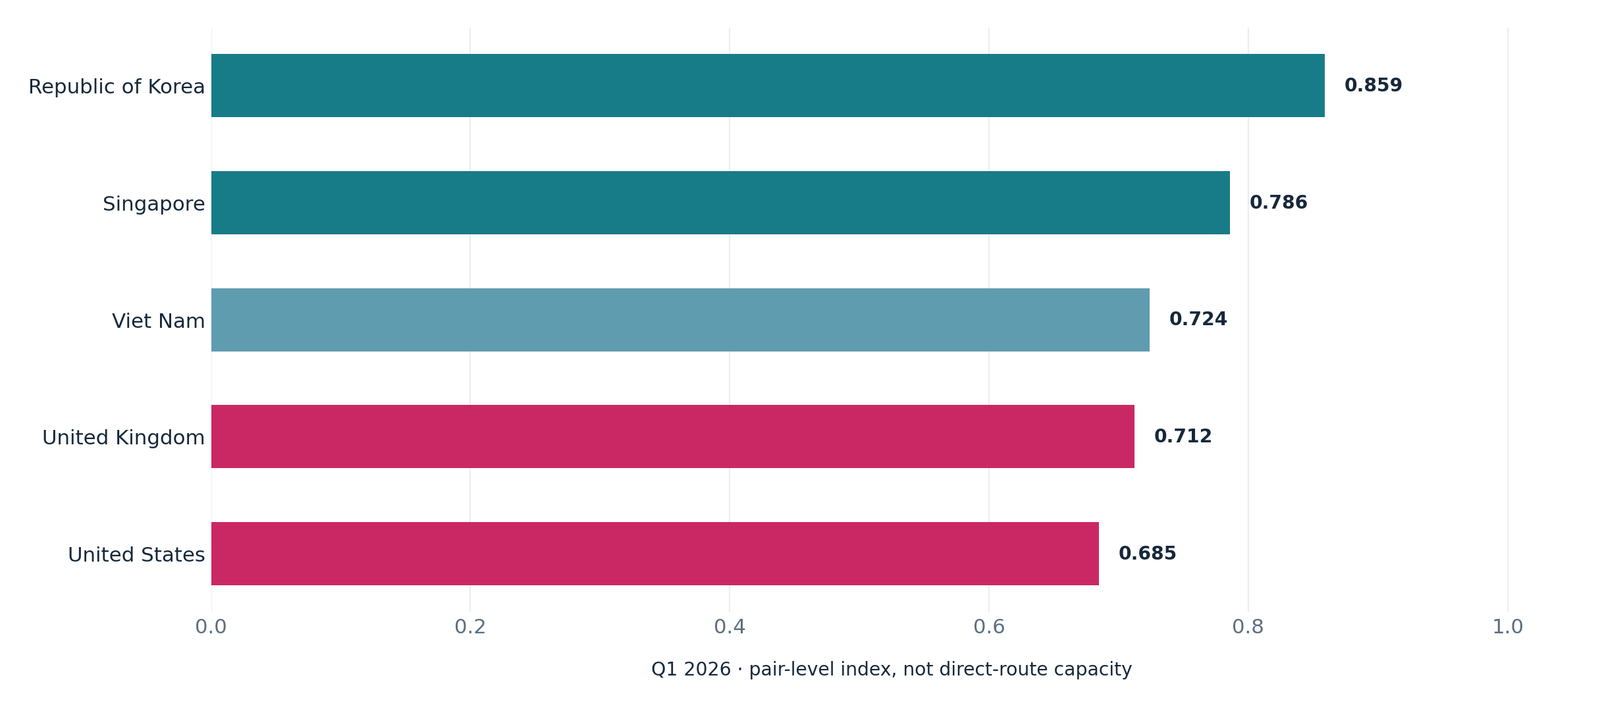
Figure 3. Regional framing of the same Q1 2026 selected observations; chart does not predict delays or quote rates.
A six-step comparison framework for importers
Step 1 — Establish the commercial delivery point
Record the actual destination address and receiving constraints. A country name is not enough for a door-to-door quotation.
Step 2 — Confirm physical cargo facts
Check the commodity, packaging, cartons, dimensions, gross weight, special handling and readiness date. Both mode and pricing depend on these facts.
Step 3 — Compare actual route proposals
Ask which Chinese port is used, whether there is transshipment, which destination terminal receives cargo, and whether the route aligns with your latest receiving date.
Step 4 — Normalize quote scope
Do not compare a port-to-port quotation with a delivered price. Identify inland trucking, origin charges, international carriage, destination fees, customs, tax responsibility and final delivery.
Step 5 — Assess variance and exceptions
Request quote validity and an escalation plan if schedules, capacity, documents or customs requirements change. An index does not model those exceptions.
Step 6 — Keep the statistical context in its proper place
Use connectivity figures to inform a market-level narrative. Make the final shipping decision from the actual service and commercial facts.
Methodology, publication date and source limitations
All numerical comparisons in this article use the selected Q1 2026 observations published in DDP Atlas's approved UNCTAD US.LSBCI dataset. The source data are reproduced on the normalized 0–1 scale with no conversion to percentages or rates. Missing later quarters remain missing. Charts are secondary visualizations, and all advice on route evaluation represents DDP Atlas's interpretation rather than an assertion made by UNCTAD.
- DDP Atlas LSBCI data and CSV download
- UNCTAD LSBCI original data viewer
- DDP Atlas methodology and sources
Suggested credit: UN Trade and Development (UNCTAD), Liner Shipping Bilateral Connectivity Index (US.LSBCI), Q1 2026; charts and interpretation: DDP Atlas Research, October 2026. Data subject to CC BY 3.0 IGO attribution. UNCTAD does not endorse DDP Atlas.
Frequently asked questions
Does LSBCI measure the amount of trade between China and another country?
No. It is a liner-network connectivity measure, not the value or tonnage of bilateral merchandise trade.
Is 0.712 equivalent to 71.2% schedule reliability?
No. Normalized index values are not reliability probabilities.
Can the index identify the cheapest freight forwarder?
No. A price depends on the shipment, service scope and current market quotation.
Why does the report say Q1 2026 if it was published in October?
Because Q1 is the only approved observation period included in the selected China-partner dataset used here. The report's publication date must not be confused with its statistical reporting period.
Does this article rank every China trade lane worldwide?
No. The displayed countries are a selected sample. It is not a comprehensive global leaderboard.
Download the research briefing
Download the companion PDF: China Trade Lane Connectivity Report 2026 (PDF) (Upload this PDF to the indicated path before publication.) Media users can also use Copy citation / Embed Code for the original dataset visualization.
Have an actual shipment to price? Compare the route-specific options and prepare a freight estimate request using the real origin, cargo and final address. The LSBCI is statistical context, not a rate quote.
Related planning resources: Compare the routes themselves on the China shipping routes index, review sea freight and air freight options, or compare shipping options.
Download the China Trade Lane Connectivity Report 2026 (PDF)
Part of the Shipping from China hub — see the wider freight planning map.